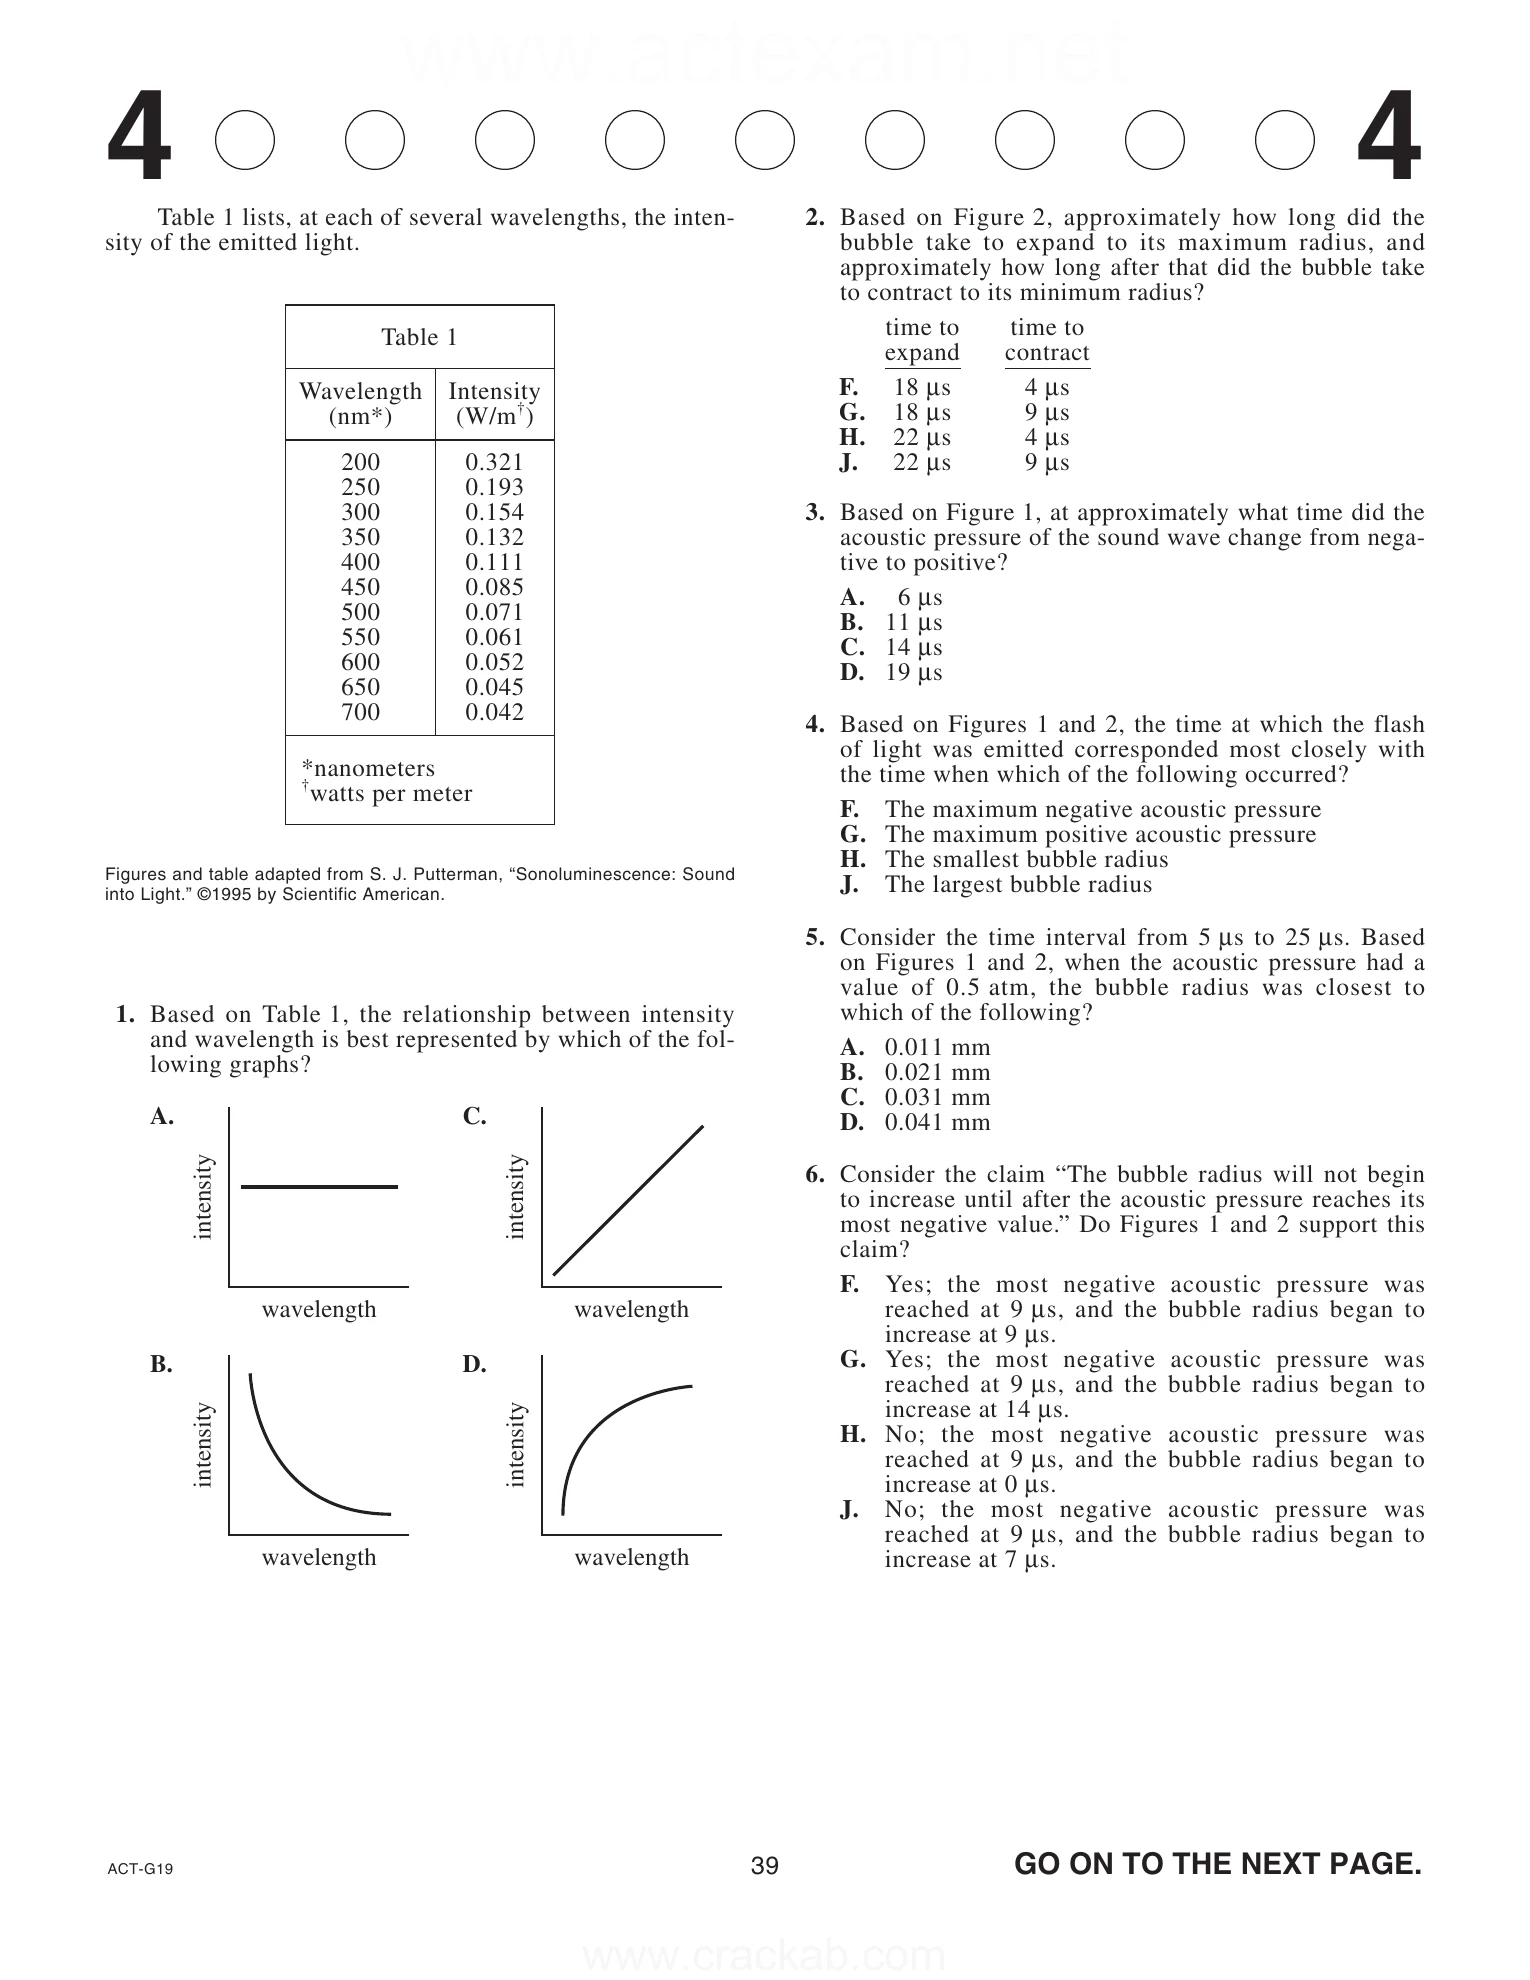
Consider the claim “The bubble radius will not begin to increase until after the acoustic pressure reaches its most negative value.” Do Figures 1 and 2 support this claim? reached at 9 μs, and the bubble radius began to increase at 9 μs. reached at 9 μs, and the bubble radius began to increase at 14 μs. reached at 9 μs, and the bubble radius began to increase at 0 μs. reached at 9 μs, and the bubble radius began to increase at 7 μs. Table 1 Wavelength (nm*) Intensity (W/m† ) 200 0.321 250 0.193 300 0.154 350 0.132 400 0.111 450 0.085 500 0.071 550 0.061 600 0.052 650 0.045 700 0.042 *nanometers † watts per meter wavelength intensity wavelength intensity wavelength intensity wavelength intensity 39 GO ON TO THE NEXT PAGE. ACT-G19 4 4 www.actexam.net www.crackab.com Passage II Students conducted a study to estimate the population size for a particular species of snail in a stream and to determine the linear distance the snails traveled in 7 days. Study The students divided into 4 groups (Groups 1−4), each of which was assigned 1 of 4 equal-sized survey areas in the stream. Each group was assigned a different color— white, red, orange, or green—and placed a rock painted that color in the center of its survey area (see Table 1). From 12:00 p.m. to 12:30 p.m., each group collected 25 snails from the group’s survey area and dried each snail’s shell using a paper towel. Then each group marked the snails using nail polish of the group’s assigned color. After the nail polish dried, each group released its snails next to the group’s assigned rock. Seven days later, from 12:00 p.m. to 12:30 p.m., each group collected all the snails it located in its survey area and counted the number of recaptured snails marked with its color (R) and the number of unmarked snails (U). Each group then used its data to calculate the estimated popula- tion size (N) for the snails in the stream (see Table 2). Each group measured the linear distance between the site of release and the site of recapture for each marked snail and determined the snails’ minimum, maximum, and average linear distance traveled (see Table 3). Table 3 adapted from Timothy W. Stewart, “Measuring Animal Movements in a Natural Ecosystem: A Mark-Recapture Investigation Using Stream- Dwelling Snails.” ©2007 by University of California Press.