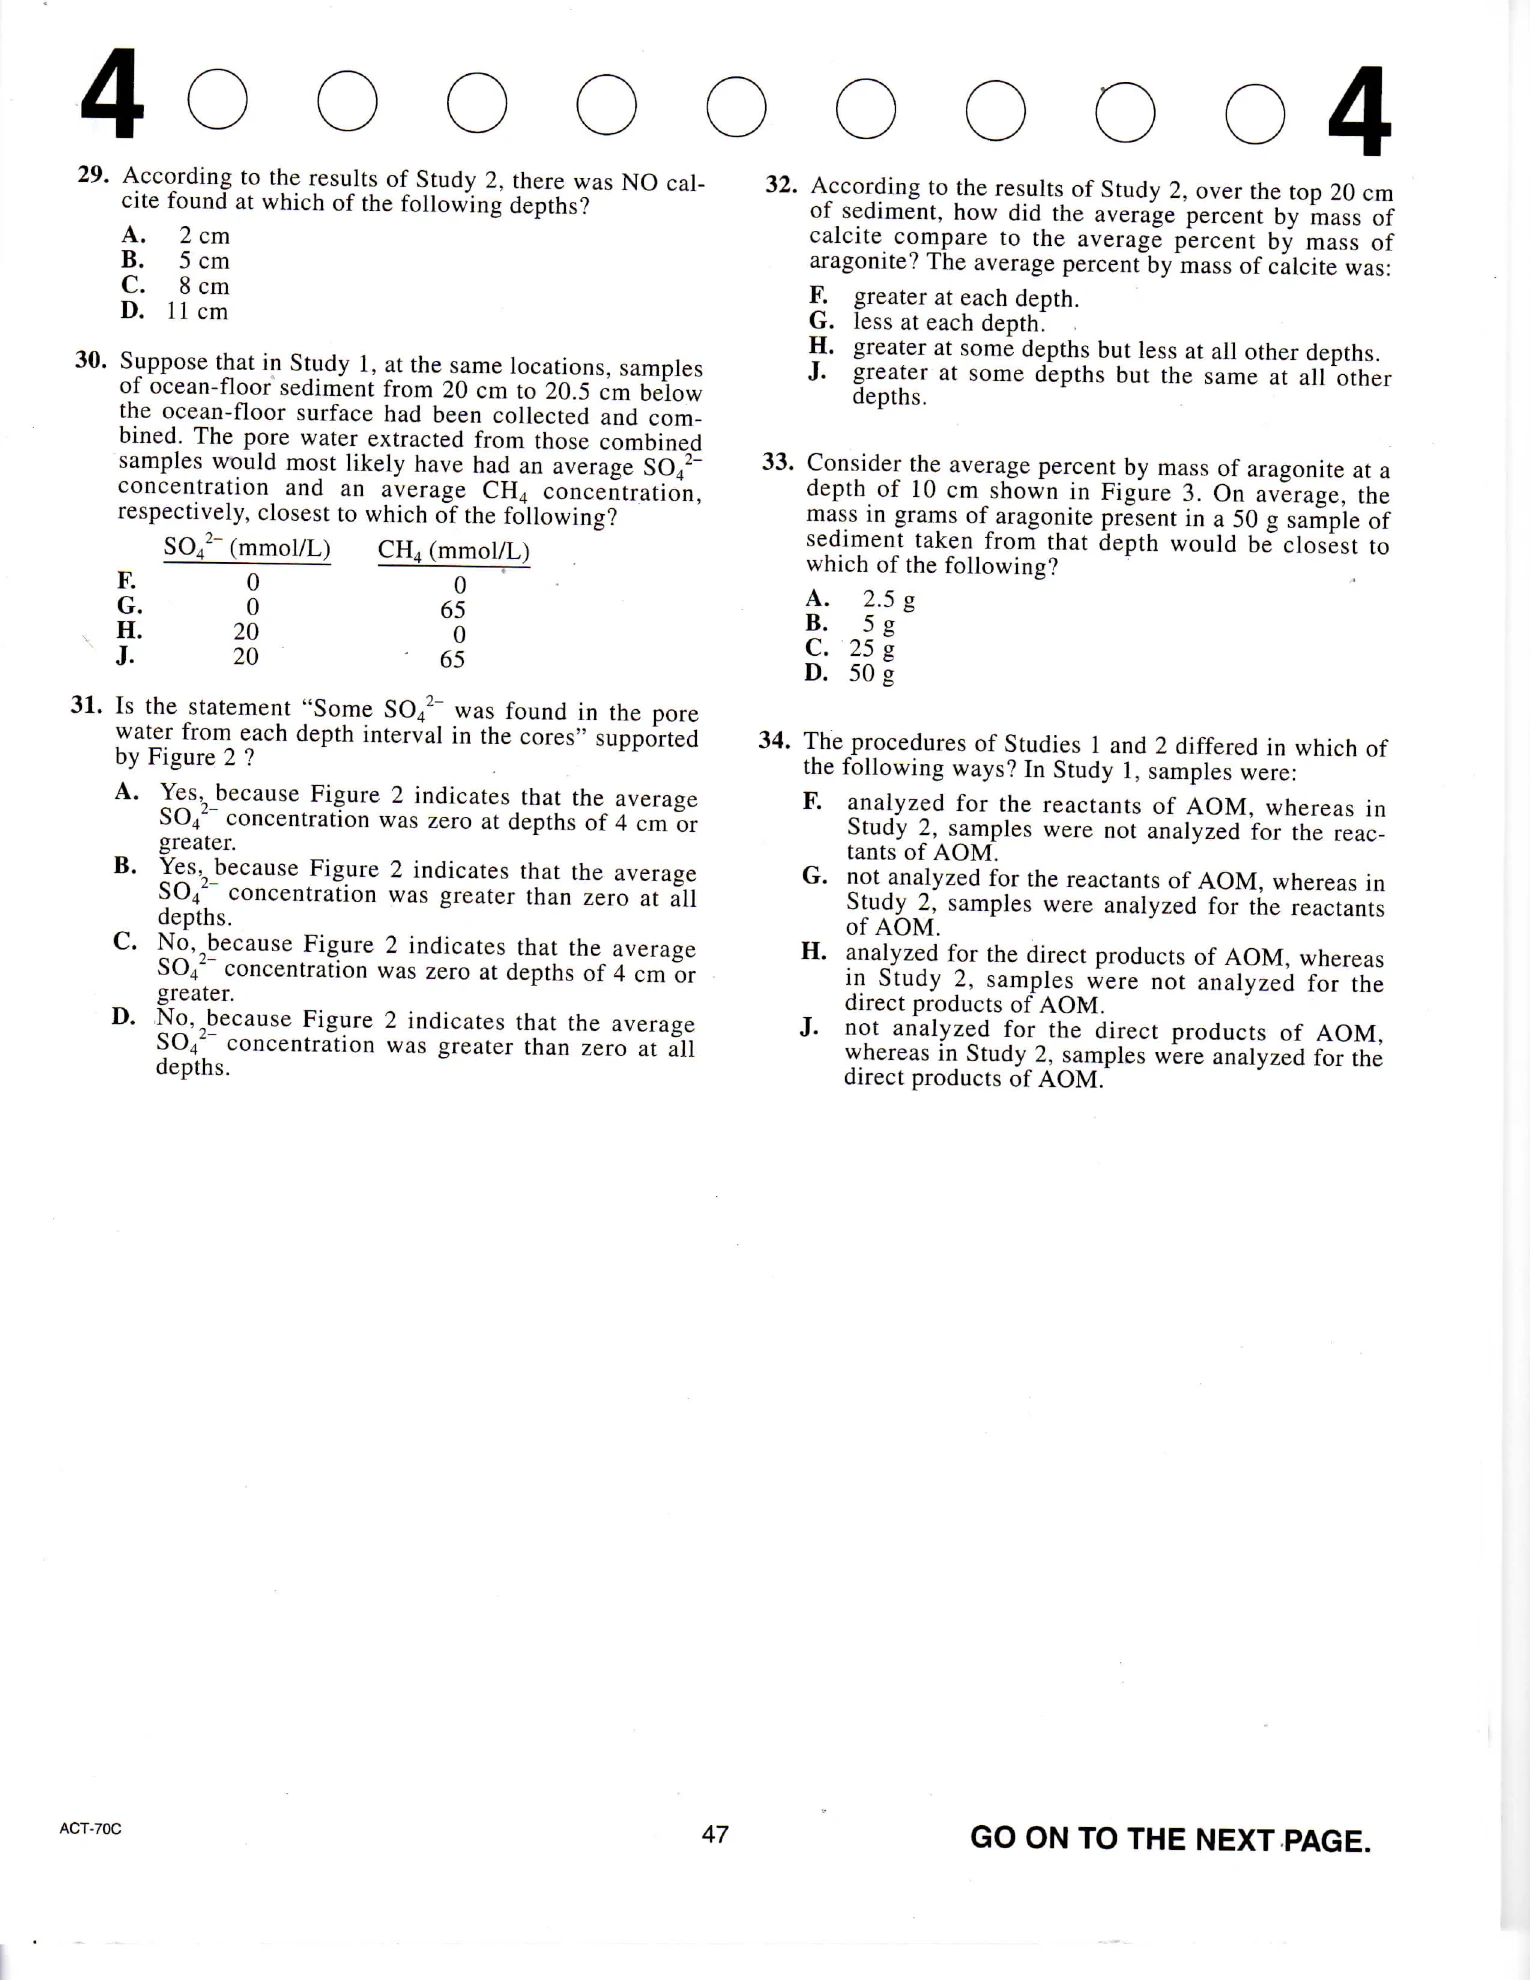
The procedures of Studies l and 2 differed in which of the following ways? In Study I, samples were.. analyzed for the reactants of AOM, whereas in Study 2. samples were not analyzed for the reac- tants of AOM. not analyzed for the reactants of AOM, whereas in Study 2, samples were analyzed for the reactants ofAOM. analyzed for the direct products of AOM, whereas in Study 2, sarnples were not analyzed for the direct products of AOM. not analyzed for the direct products of AOM, whereas in Study 2, samples were analyzed for the direct products of AOM. ACT-70C 47 GO ON TO THE NEXT PAGE. 40000000004 Passage Vll A physicist tested various sheets for their ability to stop gamma rays (y-rays) that had different energies. Any y-ray that was not stopped by a sheet struck a detector (see Figure l), which then registered a detection, or count. Experiment 2 The physicist repeated the procedures from Experi- ment I with other sources of y-rays having diffeient ener- gies. For each combination of sheet material and y-ray energy, she produced a graph of I versus x. These graphs are not shown. From the graphs of I versus x, she found the half- value thickness, Xhalf, for each combination of sheet mate- rial and y-ray energy. A sheet of thickness Xhalf Stopped half of the y-rays striking the sheet. that is, l equaled (For example, based on Figure 2, for 4 Mev y-rays striking sheets of Material I, Xhalf equaled 1.0 cm.) Finally, the physicist plotted a graph of Xhalf versus y-ray energy for each material (se& Figure 3). sheet detector y-ray source Material 3 Figure I Each sheet was made of either Material I, Material 2, or Materia13. The thickness, x, of each sheet was uniform, but sheet8 of the same material had different thicknesses. Material 2 Jo represented the number of counts per minute (cpm) with no sheet between the y-ray source and the detector, and I represented the cpm with I sheet between the source and the detector. Material I Experiment I First, the physicist measured Jo for a source of y-ray8 having an energy of 4 million electron volts (Mev). Next, with Ihis same y-ray source. she measured I for various sheets of Material I, each having a different thickness x. Then, she plotted a graph of I versus x (in cm) for Material l. Similarly, she produced graphs of I versus x for Material 2 and Material 3 (see Figure 2). y-ray energy (Mev) Figure 3 10,000 9,000 8,000 7,000 6,000