A group of 10 gardeners recorded data on the germination rates of their tomato crop for one growing season. The scatterplot shows the relationship between the number of tomato seeds planted, x, and the number of tomato seeds that germinated, y, for each of the gardeners. A line of best fit is also shown.
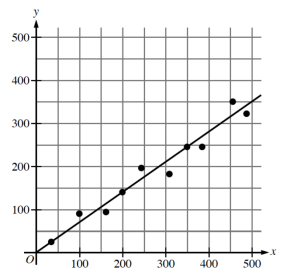
Which of the following is the best interpretation of the slope of the line of best fit in this context?
