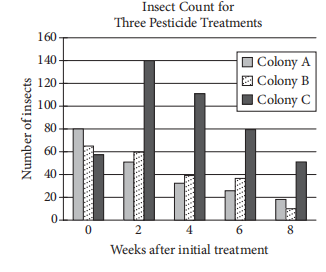
Three colonies of insects were each treated with a different pesticide over an 8-week period to test the effectiveness of the three pesticides. Colonies A, B, and C were treated with Pesticides A, B, and C, respectively. Each pesticide was applied every 2 weeks to one of the three colonies over the 8-week period. The bar graph above shows the insect counts for each of the three colonies 0, 2, 4, 6, and 8 weeks after the initial treatment. Of the following, which is closest to the ratio of the total number of insects in all three colonies in week 8 to the total number of insects at the time of initial treatment?
