As part of a study on sedimentary habitats, the water temperature was recorded at different depths below the surface of the water in the northern Alboran Sea. The data shown in the scatterplot give the recorded temperature, in degrees Celsius, for 7 depths, in meters, below the surface of the water.
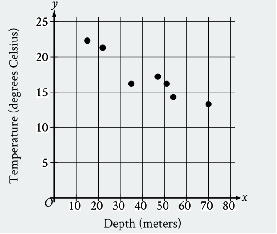
The scatterplot has 7 data points.
The data points are in a linear pattern trending down from left to right.
The data points have the following approximate coordinates:
(15 comma 22.30)
(22 comma 21.30)
(35 comma 16.20)
(47 comma 17.20)
(5l comma 16.20)
(54 comma 14.30)
(70 comma 13.30)
Which of the following is closest to the slope of a line of best fit for the data shown?
