Between 1985 and 2003, data were collected every three years on the amount of plastic produced annually in the United States, in billions of pounds The graph below shows the data and a line of best fit. The equation of the line of best fit is y = 3.39x + 46.89, where x is the number of years since 1985 and y is the amount of plastic produced annually, in billions of pounds.
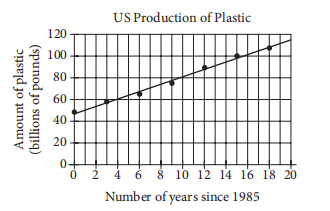
Which of the following is the best interpretation of the number 3.39 in the context of the problem?
